

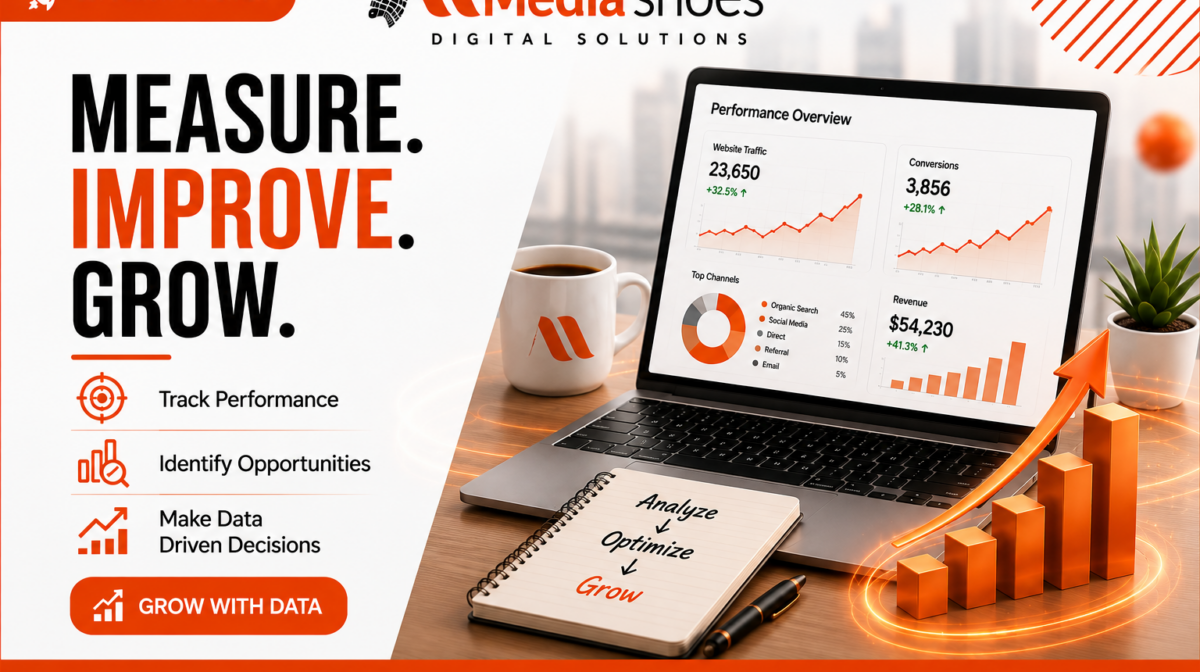
Marketing becomes significantly more powerful when businesses stop relying on assumptions and start using performance data to understand what works, what needs improvement and where the next growth opportunity lies.
Modern digital marketing generates an enormous amount of information. Website visits, search visibility, enquiries, advertising clicks, social engagement, email performance, conversions and revenue can all provide valuable signals about customer behaviour and marketing effectiveness.
But collecting data alone does not create growth. The real advantage comes from turning that information into clear, practical and commercially useful decisions.
This is the principle behind “Measure. Improve. Grow.” Measure the right activity, understand what the numbers mean, improve what matters and use those insights to create sustainable business growth.
Data Should Answer Business Questions
Effective analytics is not about producing the largest possible dashboard. It is about answering important questions: Where are customers coming from? What makes them convert? Which marketing activities create value? Where are we losing opportunities? What should we improve next?
Why Marketing Measurement Matters
Businesses invest considerable time and money in websites, SEO, paid advertising, social media, email marketing, content and lead generation. Without accurate measurement, however, it can be difficult to determine which activities are genuinely contributing to commercial performance.
Measurement creates visibility. It allows marketing teams and business leaders to move beyond opinions and evaluate performance using evidence.
- Understand performance: see which campaigns, channels and activities are producing results.
- Identify opportunities: discover areas where additional investment or optimisation may create growth.
- Detect problems: recognise declining traffic, weak conversions or inefficient campaigns earlier.
- Improve budget allocation: focus resources on activities that support meaningful objectives.
- Understand customers: learn how audiences discover, engage with and convert through digital channels.
- Support strategic decisions: use evidence to guide future marketing priorities.
The Measure → Improve → Grow Framework
Data-driven marketing can become unnecessarily complicated when businesses try to monitor everything at once. A simpler approach is to organise marketing analytics around three connected stages.
| Stage | Primary Objective | Key Question | Outcome |
|---|---|---|---|
| Measure | Understand current performance | What is happening? | Visibility |
| Improve | Optimise weak and promising areas | Why is it happening and what can we change? | Efficiency |
| Grow | Scale successful activity | Where should we invest next? | Sustainable growth |
Step 1: Measure What Actually Matters
One of the biggest mistakes in digital marketing analytics is measuring activity simply because the data is available. Modern platforms can produce hundreds of metrics, but not every metric deserves equal attention.
The most useful measurements are those connected to genuine business objectives.
For example, a company focused on lead generation may care more about qualified enquiries, conversion rate and cost per lead than total social media impressions. An ecommerce business may prioritise revenue, average order value, customer acquisition cost and repeat purchases.
Measurement should therefore begin with the business objective, not the analytics platform.
A useful rule:
If a metric changes significantly but nobody knows what business decision should follow, it may not deserve prominent space on the main performance dashboard.
Marketing Metrics vs Business KPIs
Marketing metrics and business KPIs are related, but they are not always the same thing. Metrics describe activity. KPIs measure progress toward an important objective.
| Marketing Metric | What It Shows | Potential Business KPI |
|---|---|---|
| Website Traffic | Number of visits/users | Qualified traffic growth |
| Ad Clicks | Advertising engagement | Cost per qualified lead |
| Keyword Rankings | Search visibility | Organic enquiries/revenue |
| Email Opens | Initial engagement | Email-generated conversions |
| Social Engagement | Audience interaction | Qualified traffic/leads |
Website Traffic: Look Beyond the Headline Number
Website traffic is one of the most commonly monitored marketing metrics, but total visitor numbers can be misleading when viewed in isolation.
Ten thousand relevant visitors with strong purchase or enquiry intent may be more valuable than one hundred thousand visitors who leave without taking meaningful action.
Useful website analysis should consider:
- Total users and sessions
- Traffic growth over time
- Traffic sources and channels
- Landing-page performance
- Engagement behaviour
- Device type
- Geographic relevance
- Conversion performance
- New versus returning visitors
The objective is not simply to increase traffic. It is to attract more of the right audience and convert that attention into meaningful business outcomes.
Understand Where Your Customers Come From
Channel analysis helps businesses understand how potential customers discover them. Common sources may include organic search, paid advertising, social media, email, referral websites and direct traffic.
Looking at these channels side by side can reveal important differences. One channel may generate large traffic volumes but relatively few conversions, while another may generate fewer visits but significantly stronger commercial results.
| Channel | What to Measure | What to Investigate |
|---|---|---|
| Organic Search | Traffic, rankings, conversions | Which search topics generate business value? |
| Paid Advertising | Clicks, CPC, conversions, CPA | Which campaigns efficiently generate results? |
| Social Media | Reach, engagement, traffic, leads | Does engagement translate into meaningful action? |
| Clicks, conversions, enquiries | Which messages and segments perform best? | |
| Referral | Visits, quality, conversions | Which external sources send valuable prospects? |
Conversion Rate: Where Marketing Meets Business Performance
Traffic tells you that people arrived. Conversion data helps determine whether they took the action the business wanted.
A conversion can mean different things depending on the organisation. It may include:
- Submitting an enquiry form
- Calling the business
- Booking a consultation
- Requesting a quote
- Downloading a resource
- Registering for an event
- Subscribing to a service
- Completing a purchase
Tracking conversions connects marketing activity to measurable customer action.
Conversion Rate Formula
Conversions ÷ Visitors × 100 = Conversion Rate
However, conversion rate should also be interpreted in context. A lower-volume campaign generating highly valuable enquiries may outperform a high-volume campaign producing poor-quality leads.
Step 2: Identify Opportunities Hidden in the Data
Once accurate measurement is in place, analytics can reveal where marketing performance can be improved.
This is where reporting becomes analysis. Instead of simply saying, “traffic increased by 15%,” the marketing team asks why it increased, which pages benefited, which channels contributed and whether the additional traffic generated meaningful outcomes.
Common opportunities data can reveal include:
- High-traffic pages with poor conversion rates
- Keywords ranking close to prominent search positions
- Campaigns generating leads at an efficient cost
- Strong-performing audience segments
- Landing pages with unusually high engagement
- Content topics attracting valuable prospects
- Channels producing high-quality customers
- Customer journey stages where prospects frequently leave
These opportunities may already exist inside the business’s current marketing activity. Analytics simply makes them easier to see.
Finding Conversion Leaks
Growth is not always about attracting more people. Sometimes the greatest opportunity comes from improving what happens to existing traffic.
Imagine a website attracting thousands of relevant visitors every month but producing very few enquiries. Increasing traffic may create additional leads, but improving the website’s conversion experience could potentially generate better results from the audience already arriving.
Potential conversion barriers include:
- Unclear value propositions
- Weak calls to action
- Complicated forms
- Slow page performance
- Poor mobile experience
- Confusing navigation
- Insufficient trust signals
- Content that does not match search intent
- Too many distractions
Step 3: Turn Insights Into Improvements
Analytics creates value only when insights lead to action. Once an opportunity or problem has been identified, businesses should develop a clear hypothesis and test an improvement.
Example Optimisation Cycle
1. Observe: A service page receives significant traffic but generates few enquiries.
2. Analyse: Visitors engage with the content but rarely reach the enquiry form.
3. Hypothesise: The call to action may not be visible enough.
4. Improve: Introduce a clearer CTA and simplify the enquiry journey.
5. Measure: Compare conversion performance after the change.
6. Learn: Keep, refine or replace the change based on the result.
Marketing Should Be a Continuous Improvement System
The strongest digital strategies are rarely finished. Markets change, competitors evolve, customer behaviour shifts and new channels emerge.
Marketing should therefore operate as a continuous cycle:
Measure → Analyse → Improve → Test → Learn → Grow → Repeat
This approach replaces large amounts of guesswork with incremental learning. Each campaign and optimisation contributes additional information that can improve future decisions.
SEO Performance: Measure More Than Rankings
Keyword rankings are useful, but ranking positions alone do not provide a complete picture of SEO performance.
An effective SEO measurement framework can include:
- Organic visibility
- Relevant keyword rankings
- Organic traffic
- Search click-through rate
- Landing-page engagement
- Backlink quality
- Technical SEO performance
- Organic conversions
- Qualified enquiries
- Revenue influenced by organic search
A keyword reaching position one can look impressive, but if that search term has little relevance to the business and generates no valuable action, its commercial importance may be limited.
SEO reporting should therefore connect visibility → traffic → engagement → conversion → business outcome.
Paid Advertising: Measure Efficiency, Not Just Clicks
Advertising platforms make it easy to monitor impressions and clicks, but businesses ultimately need to understand what happens after the click.
Important paid advertising metrics may include:
- Click-through rate (CTR)
- Cost per click (CPC)
- Conversion rate
- Cost per acquisition or lead
- Lead quality
- Revenue generated
- Return on advertising spend
A campaign with cheap clicks is not necessarily efficient if those visitors never become customers. Conversely, a campaign with a higher cost per click may be commercially valuable if it consistently reaches high-intent prospects.
Content Marketing: Measure Its Role Across the Journey
Content does not always generate an immediate conversion. A prospect may discover a business through an article, return through organic search, read a case study and later submit an enquiry.
This means content performance should be evaluated beyond simple page views.
Useful content indicators include:
- Relevant organic traffic
- Engaged visitors
- Internal navigation to commercial pages
- Lead generation
- Assisted conversions
- Search visibility
- Backlinks
- Returning visitors
Social Media: Separate Attention From Outcomes
Likes, comments, shares and followers can indicate audience interest, but they should not automatically be treated as business growth.
A more complete social media measurement strategy considers both engagement and downstream behaviour.
| Stage | Possible Metrics |
|---|---|
| Awareness | Reach, impressions, video views |
| Engagement | Comments, shares, saves, interactions |
| Consideration | Profile visits, website clicks, content consumption |
| Conversion | Enquiries, registrations, purchases |
Email Marketing: Analyse Behaviour, Not Just Opens
Email can provide valuable direct communication with prospects and customers. While traditional engagement indicators remain useful, businesses should pay particular attention to actions that demonstrate genuine interest.
These can include link clicks, website visits, form submissions, purchases, replies and other conversions generated after email interaction.
Segmentation can make this analysis even more valuable. Different audience groups may respond differently to messaging, offers, topics and timing.
Understanding Customer Acquisition Cost
Growth becomes difficult to sustain when a business does not understand how much it costs to acquire customers.
Simplified Customer Acquisition Cost
Sales & Marketing Acquisition Costs ÷ New Customers Acquired
The exact calculation can vary depending on the organisation, but the principle is important. Marketing performance should eventually connect expenditure with customer acquisition and value.
Customer Lifetime Value Adds Important Context
Acquisition cost becomes more meaningful when considered alongside customer value. Some customers make a single purchase, while others may remain with a business for years.
A marketing channel that appears expensive based only on initial acquisition cost may still be valuable if it consistently attracts customers with stronger long-term value.
This is why mature marketing analytics increasingly connects marketing data with sales and customer information rather than evaluating each channel independently.
Build Dashboards for Decisions, Not Decoration
A useful marketing dashboard should help someone understand performance quickly and determine whether action is required.
It does not need dozens of charts. In many cases, a smaller collection of meaningful KPIs creates greater clarity.
A practical executive dashboard could include:
- Qualified website traffic
- Leads or enquiries
- Conversion rate
- Cost per lead/customer
- Channel contribution
- Organic search performance
- Paid advertising efficiency
- Revenue or pipeline influenced by marketing
- Performance against previous periods
The Difference Between Reporting and Analysis
Reporting tells you what happened. Analysis helps explain why it happened and what should happen next.
| Reporting | Analysis |
|---|---|
| Organic traffic increased 18%. | Which pages and keywords created the increase? |
| Conversions decreased. | Which channel, device or journey stage caused the decline? |
| Advertising generated 120 leads. | How many were qualified and what did acquisition cost? |
| Social engagement increased. | Did the additional engagement influence traffic or enquiries? |
Avoid Vanity Metrics
Vanity metrics are numbers that may look impressive but provide limited information about actual business performance when viewed alone.
Examples can include follower counts, impressions, raw website traffic or total video views. These numbers are not inherently useless. The problem occurs when they are presented as proof of success without connecting them to meaningful objectives.
Instead of asking, “Did this number increase?”, ask:
- Did we reach the right audience?
- Did engagement improve?
- Did more prospects enter the customer journey?
- Did lead quality improve?
- Did conversions increase?
- Did customer acquisition become more efficient?
- Did the activity contribute to commercial growth?
Attribution: Understanding Marketing’s Contribution
Customers rarely follow a perfectly linear journey. Someone may first discover a company through social media, later search for the brand, visit several pages, receive an email and finally convert after clicking a paid advertisement.
If the business credits only the final interaction, earlier marketing activity may appear less valuable than it actually was.
Attribution analysis attempts to understand how different touchpoints contribute to conversion. No attribution model is perfect, but considering the complete customer journey can provide a more balanced understanding than relying exclusively on the last click.
Data Quality Comes Before Data Analysis
Poor-quality tracking creates poor-quality decisions. Before building sophisticated reports, businesses should ensure that important digital interactions are being recorded consistently.
A measurement review can consider:
- Are important conversions being tracked?
- Are duplicate conversions inflating results?
- Are campaign links consistently tagged?
- Are internal visits distorting website data?
- Are marketing and sales systems aligned?
- Are reporting definitions consistent?
- Do teams understand what each KPI means?
Remember: A beautiful dashboard built on inaccurate tracking can create more confusion than having no dashboard at all.
From Marketing Analytics to Revenue Intelligence
The most valuable analytics systems connect marketing activity with the wider commercial journey.
Instead of stopping at clicks or form submissions, businesses can work toward understanding:
- Which channels generate qualified leads?
- Which campaigns contribute to sales opportunities?
- Which customer segments generate stronger value?
- Which services receive the greatest demand?
- Which marketing activities influence revenue?
- Where are prospects being lost between marketing and sales?
This creates a stronger relationship between marketing investment and business performance.
How Data Improves Marketing Budget Allocation
Marketing budgets should not remain static simply because the same allocation was used previously. Performance data can help organisations understand where additional investment may create the greatest return.
For example, analytics may show that organic search generates highly qualified enquiries but important commercial pages still have substantial growth potential. Alternatively, paid search may perform strongly for one service but inefficiently for another.
The objective is not necessarily to move every pound toward the channel with the lowest immediate acquisition cost. Businesses should consider scalability, customer value, strategic importance and long-term growth alongside short-term efficiency.
Create a Practical Marketing Measurement Plan
- Define business objectives. Clarify what marketing is expected to contribute.
- Select meaningful KPIs. Choose measurements directly connected to those objectives.
- Audit tracking. Confirm that required data is being collected accurately.
- Establish benchmarks. Understand current performance before setting improvement targets.
- Create focused reporting. Build dashboards around decisions rather than available metrics.
- Analyse performance. Investigate causes, patterns and opportunities.
- Prioritise improvements. Focus on changes likely to create meaningful impact.
- Test and measure. Evaluate whether changes actually improve results.
- Scale successful activity. Invest further where evidence supports growth.
A Simple Monthly Marketing Review
| Review Area | Question | Possible Action |
|---|---|---|
| Traffic | Are we attracting the right visitors? | Improve channel/keyword targeting |
| Engagement | Are visitors finding useful content? | Improve content and UX |
| Conversions | Are visitors taking meaningful action? | Optimise CTAs and landing pages |
| Lead Quality | Are campaigns attracting suitable prospects? | Refine targeting and messaging |
| Cost | Are we acquiring results efficiently? | Reallocate budget |
| Growth | What should we scale next? | Increase investment strategically |
Why Data-Driven Marketing Creates a Competitive Advantage
Companies operating without reliable measurement may continue investing in weak campaigns because those campaigns appear busy. They may overlook valuable opportunities because nobody has identified the pattern hidden inside the data.
A data-driven organisation creates a learning advantage.
Every campaign produces information. Every website interaction provides behavioural signals. Every conversion reveals something about customer intent. When that information is systematically analysed and applied, marketing can improve continuously.
Measure What Matters. Improve What Works. Grow With Confidence.
Successful marketing is not built around collecting the largest number of clicks, followers or impressions. It is built around understanding how marketing contributes to customer acquisition, engagement, conversion and sustainable commercial growth.
Track performance → Identify opportunities → Make data-driven decisions → Optimise → Grow.
Frequently Asked Questions About Marketing Analytics
What is data-driven marketing?
Data-driven marketing uses relevant customer, campaign and performance information to guide marketing decisions rather than relying primarily on assumptions or intuition.
Which marketing metrics should a business track?
The right metrics depend on business objectives. Common examples include qualified traffic, conversions, cost per lead, customer acquisition cost, organic visibility, advertising performance and revenue influenced by marketing.
Is website traffic an important KPI?
Traffic can be useful, but volume alone does not indicate success. Traffic quality, engagement and conversion performance provide important additional context.
What is conversion rate optimisation?
Conversion rate optimisation focuses on improving the percentage of visitors who complete a desired action, such as submitting an enquiry, requesting a quote or completing a purchase.
Why are marketing dashboards useful?
Well-designed dashboards bring important KPIs together so teams can identify trends, problems and opportunities without manually reviewing multiple data sources every time.
What is the difference between a metric and a KPI?
A metric measures an activity or result, while a KPI is a strategically important measurement used to evaluate progress toward a defined objective.
How often should marketing performance be reviewed?
The appropriate frequency depends on the campaign and business. Some paid campaigns may require frequent monitoring, while broader strategic performance may be reviewed weekly, monthly or quarterly.
Does more marketing data always lead to better decisions?
No. More data can create additional complexity if it is inaccurate, irrelevant or poorly interpreted. High-quality measurement should focus on information that supports useful decisions.
Final Thoughts
The purpose of marketing analytics is not simply to prove that marketing activity happened. It is to understand whether that activity created value and how future performance can become stronger.
Businesses that measure meaningful outcomes gain visibility. Visibility reveals opportunities. Those opportunities create informed improvements. And improvements, repeated consistently over time, create growth.
This is why Measure. Improve. Grow. is more than a reporting process. It is a practical approach to building smarter marketing.
Start with clear objectives. Track the metrics connected to those objectives. Understand customer behaviour across channels. Identify weak points and opportunities. Test improvements. Measure the result. Then use what you learn to make the next decision better than the last.
Because the real value of data is not found inside a dashboard — it is found in the decisions that dashboard helps you make.
Measure. Improve. Grow.
Turn marketing performance into clearer decisions, stronger optimisation and sustainable digital growth.
Media Shoes Digital Solutions
www.mediashoes.com | info@mediashoes.com